Page contents
How do you analyse the head losses of a network graphically?
Graphical analysis plots the head losses of a network against flow rate: in turbulent flow they grow with the square of the flow, ΔH ≈ ΔH₀ × (Q/Q₀)². On the same chart, the curve of the pump or of the supply tank crosses the system curve at the operating point, the flow actually obtained. The chart also shows the share of each component in the total loss and the resulting energy cost, which immediately identifies the component to resize. Example: a network losing 15 m at 10 m³/h requires 409 W of hydraulic power; with a pump at 60% efficiency running 4,000 hours a year, that is 2,725 kWh, about €545 at €0.20/kWh.
Graphical analysis formulas
- ΔH(Q): head loss at flow rate Q, in m, from the value ΔH₀ known at flow rate Q₀
- Hpump(Q) = Hsystem(Q): condition of the operating point, where the two curves cross
- E: energy consumed, in Wh, over t hours, with η the pump efficiency
Head loss and power against flow rate
| Flow rate (m³/h) | Head loss (m) | Input power (W) |
|---|---|---|
| 4 | 2.4 | 44 |
| 6 | 5.4 | 147 |
| 8 | 9.6 | 349 |
| 10 | 15.0 | 681 |
| 12 | 21.6 | 1,177 |
Detailed explanations and calculation in Mecaflux
The distribution of fluids, liquids or gases, air or water, are studied in order to provide the desired flow rate with minimum cost of installation, maintenance and operation.
To make the right choice, we must properly size ducts, and organs of the network, taking into account the evolution of the flow. It may be wise to create graphics and save it, to compare and argue the technical choices in groupsto compare and argue the technical choices in groups.
The graphical analysis tool was created for this purpose. it allows you to test your inventory losses under different flow rates.
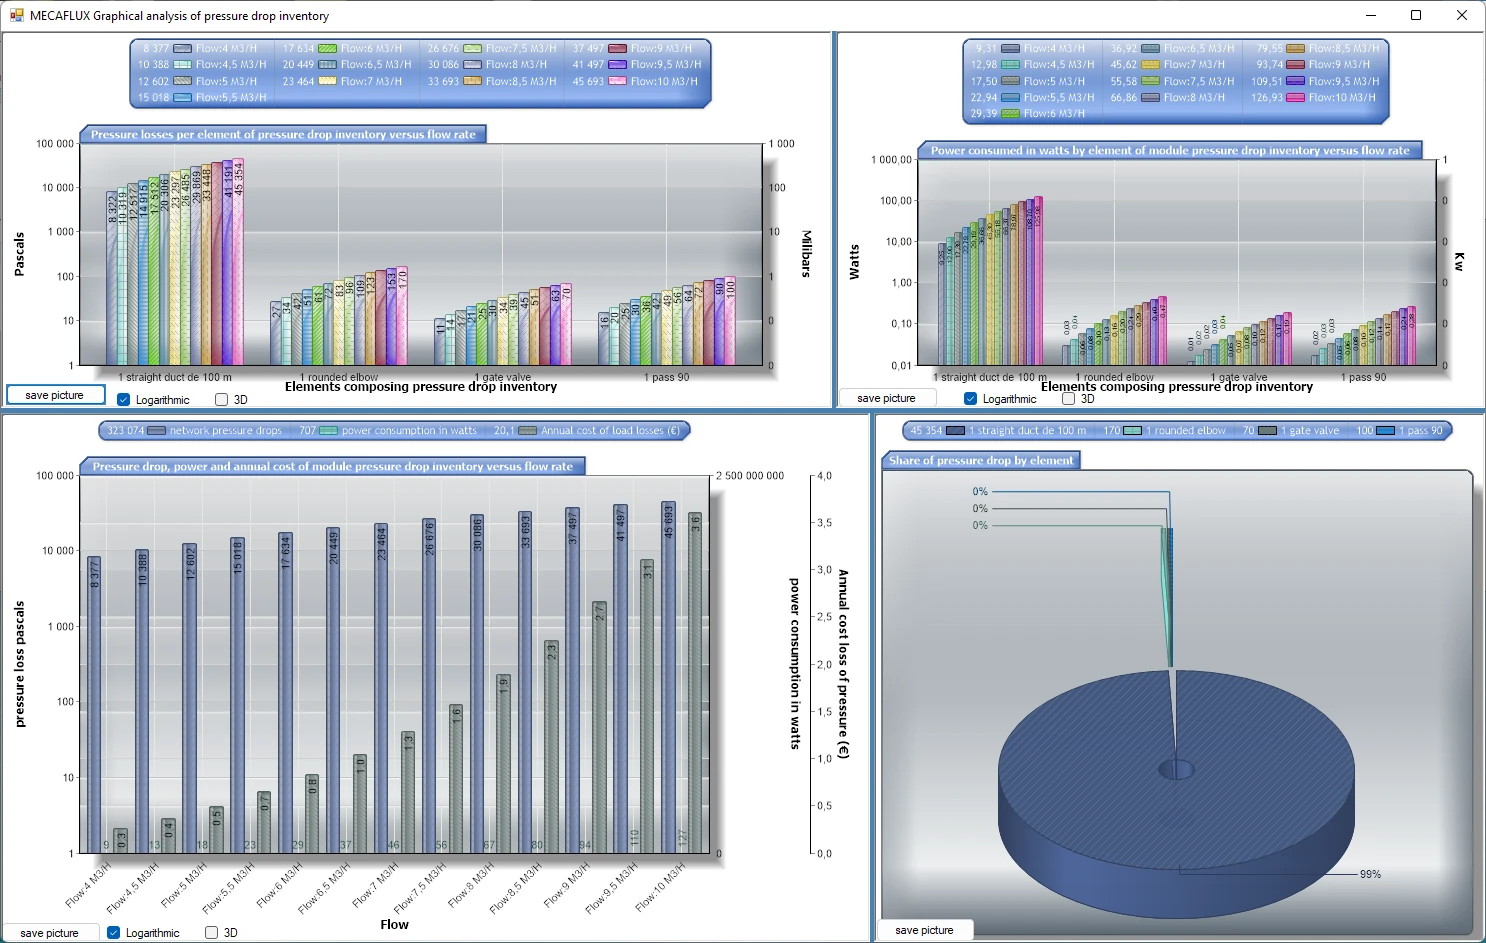
The head loss graphs show:
- the proportions of losses for the network elements,
- Energy consumption
- and the cost of losses.
Whether an element is improperly sized, this will appear with evidence in operating cost or loss of pressure.
This allows to visualize the consequences of choice of equipment, in terms of operating costs, and create simulations of different networks in order to find the best compromise.
We need to know the operating curve of the reservoir (load), and the operating curve of the network.The intersection of the two curves gives the operating point.
Pressure drop curve of the network:
- Calculate the pressure drop at an approximate rate (unimportant because the flow will be reviewed)
of the elements of the segment connected to your tank with inventory losses..and Register your inventory loss.. - Open the graphical analysis (menu tools / graphical analysis) and load your saved segment..
Curve of the tank (allows to know the max):
-
Select "Search for the operating point"
- select "fluid reservoirs"
- Enter the height of liquid
- Enter the outlet diameter
click create tank curve
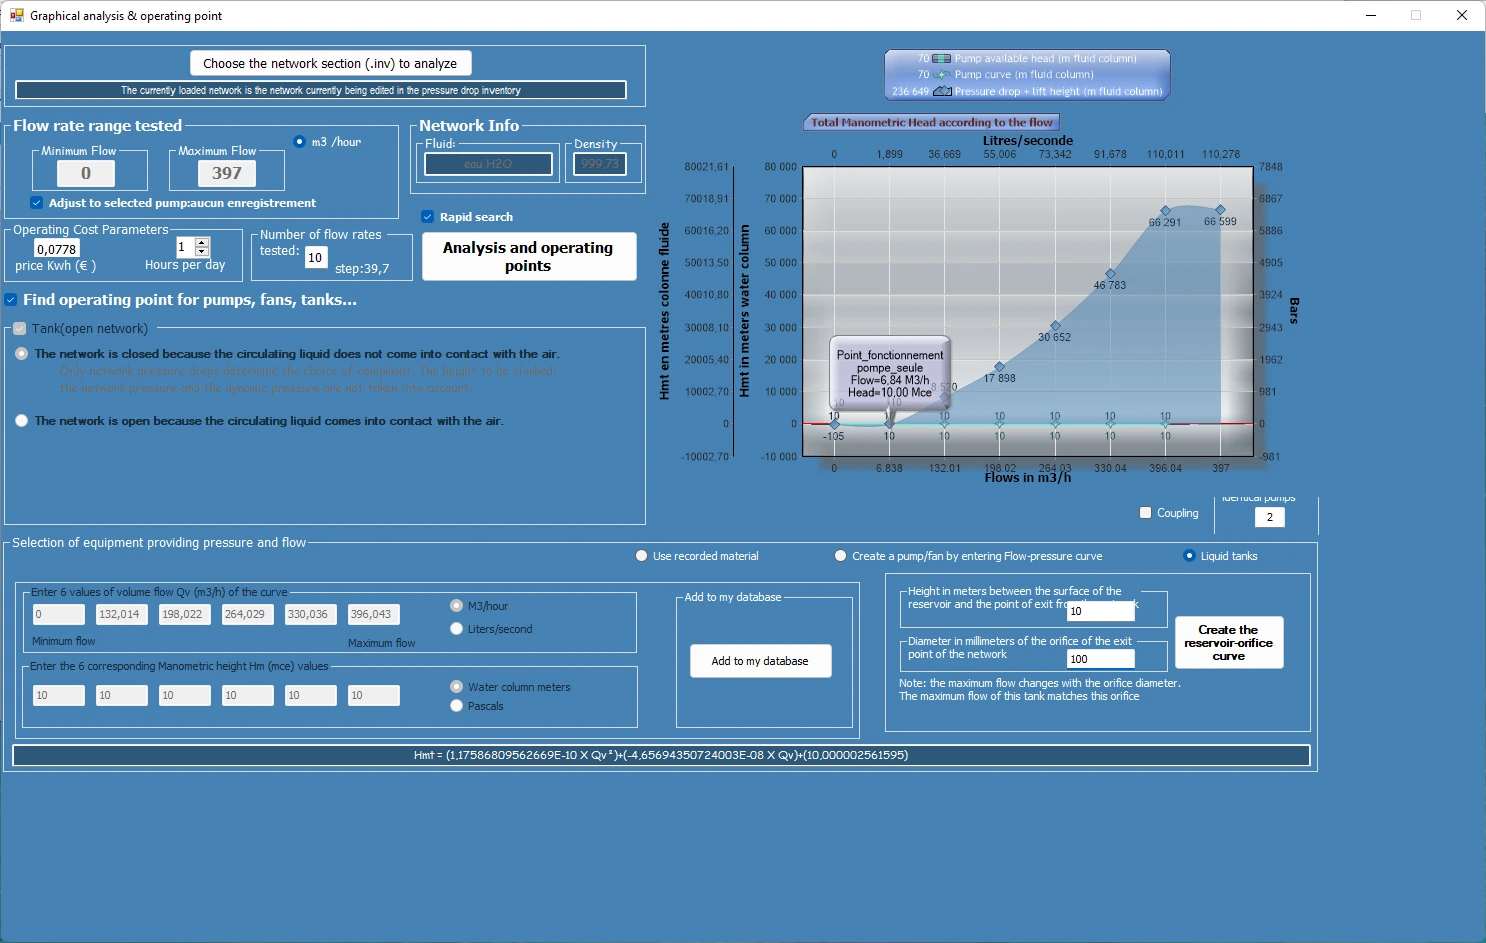
click on "Start graphical analysis"
if it exists, your operating point appears on the graph.
Otherwise this is that the flow range is not compatible, you must resize the orifice diameter.
Frequently asked questions
Why does head loss grow with the square of the flow rate?
It is proportional to the dynamic pressure ρV²/2, and velocity is proportional to flow rate. As power equals flow × loss, it grows roughly with the cube of the flow rate: +20% flow means +73% power in the example above.
What is the operating point?
It is the flow rate at which the head supplied by the pump, or the head of a tank, exactly equals the network losses. The network settles there by itself.
How do I spot an undersized component?
It stands out in the proportions chart: a bend, a valve or a section that is too small concentrates a share of the total loss out of proportion with its length. Moving to the next size up often cuts the energy bill noticeably.
Which tool should I use for this analysis?
The graphical analysis tool of Mecaflux Standard tests your head loss inventory over a whole range of flow rates, shows the proportions per component, the consumption and the cost, then finds the operating point with your pump or tank. For a specific case, Mecaflux also offers a study of your project or training on the software.